Teaching Illustrating Program Design: Flowcharts & Pseudocode in Grades 9-10 (Level 1): Oklahoma Standard L1.AP.PD.04
Teaching Illustrating Program Design: Flowcharts & Pseudocode in Grades 9-10 (Level 1): Oklahoma Standard L1.AP.PD.04
Teaching flowcharts and pseudocode in grades 9-10 (level 1) does not have to be complicated. Picture a software engineer sketching a flowchart to get team agreement on a feature's logic before writing production code. That kind of thinking is exactly what Oklahoma's grades 9-10 (level 1) computer science standard L1.AP.PD.04 asks students to practice — and it is very teachable with the right materials. This post walks through what the standard means, the misconceptions students bring to it, and discussion starters you can use tomorrow, whether you teach in a classroom or at your kitchen table.
What Does Standard L1.AP.PD.04 Actually Ask?
Using visual aids and documentation, illustrate the design elements and data flow (e.g., flowcharts, pseudocode) of the development of a complex program. — Oklahoma Academic Standards for Computer Science (February 2023)
In plain language: This standard asks Level 1 students (grades 9-10) to use diagrams and written descriptions — flowcharts and pseudocode — to illustrate how a complex program is designed and how information moves and changes as the program runs.
In student-friendly terms, the learning target is: "I can use visual aids and documentation, including flowcharts and pseudocode, to illustrate the design elements and data flow of a complex program's development."
What Students Should Be Able to Do
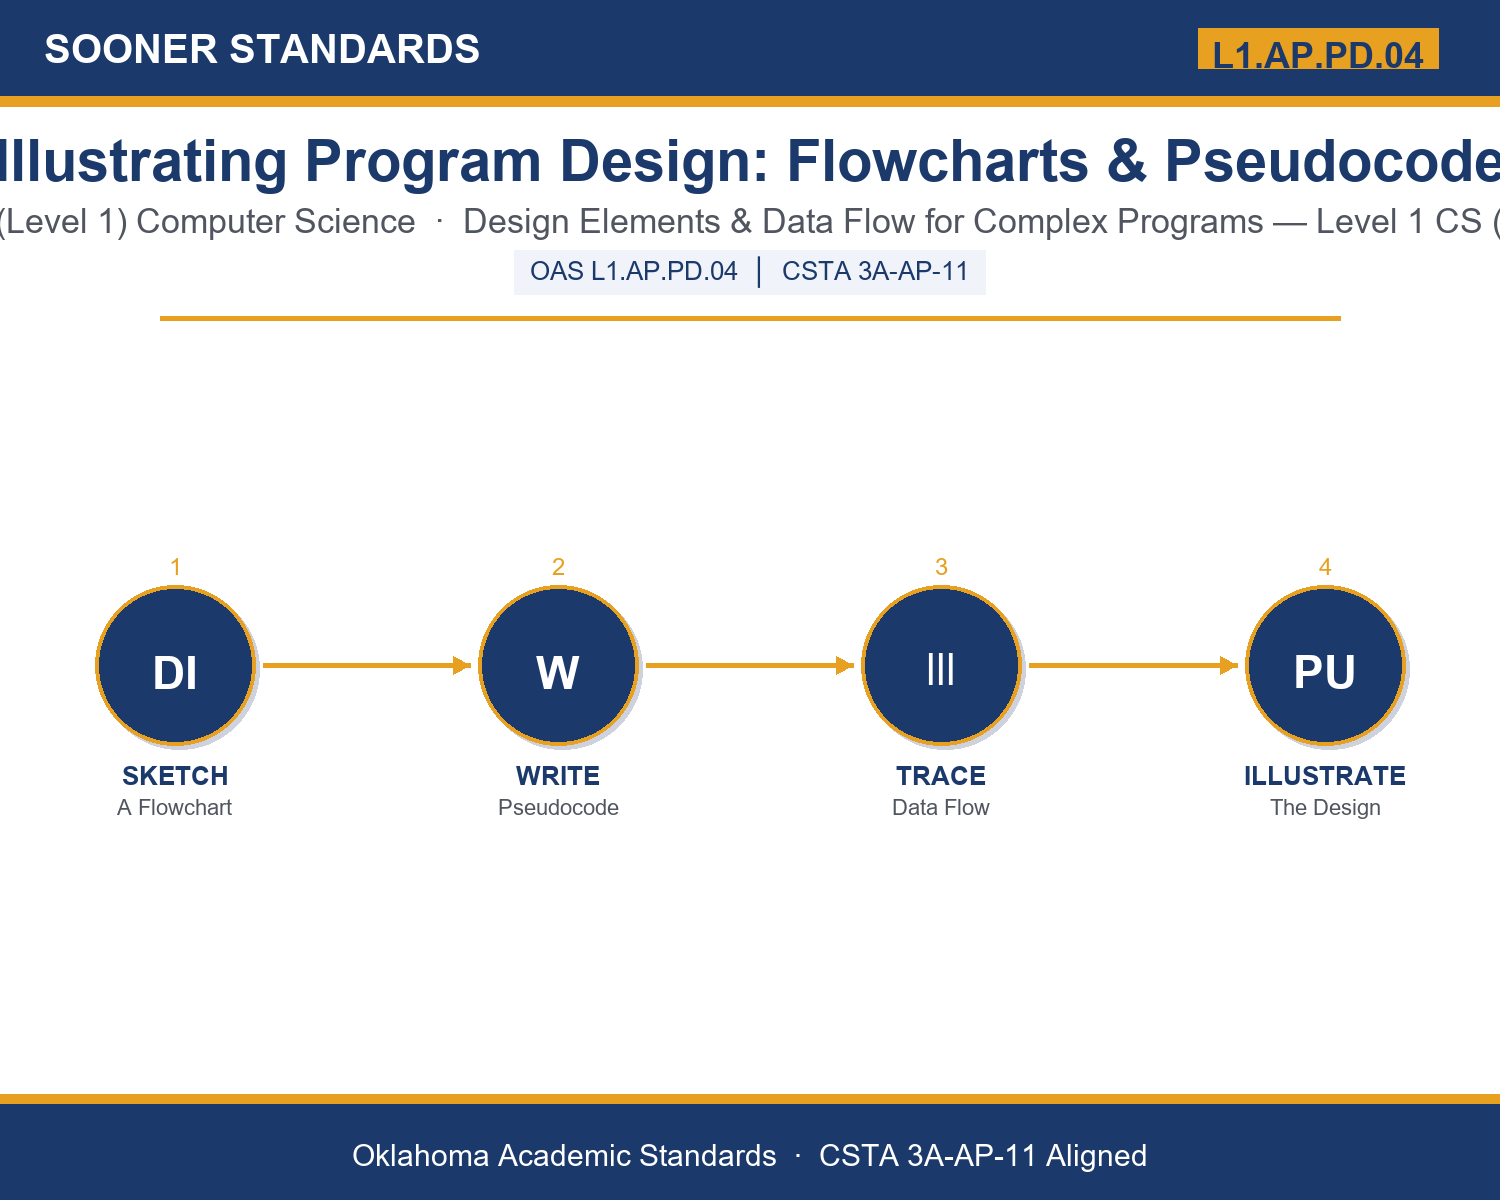
- I can build a flowchart using correct shapes for start/end, process steps, and decisions.
- I can write pseudocode that matches a flowchart's logic in plain-language steps.
- I can trace a program's data flow from input, through transformation, to output.
- I can explain how decomposition breaks a complex program into modules and subroutines that documentation helps connect.
Along the way, students pick up the working vocabulary of the topic: flowchart, pseudocode, documentation, algorithm, variable, loop, conditional, subroutine, iteration, module, decomposition, annotation.
Flowcharts And Pseudocode: Misconceptions to Watch For
These are the wrong turns students reliably take with this standard — knowing them ahead of time is half the lesson plan. Each correction strategy below comes straight from the unit's teacher guide (the paragraph and activity references point into the unit itself).
1. "A flowchart and pseudocode are just two names for the same thing."
Return to paragraph 3. Both represent the same underlying logic, but a flowchart uses shapes and arrows while pseudocode uses plain-language sentences; have students convert one small flowchart into pseudocode to see the relationship directly.
2. "Documentation is something you write after a program is finished, mostly to satisfy a teacher or grader."
Point back to paragraph 1 and the teacher background note: professionals design with flowcharts and pseudocode BEFORE writing code, to catch logic errors while they are still cheap to fix.
3. "A diamond shape in a flowchart just means 'something happens here,' the same as a rectangle."
Emphasize paragraph 2's shape definitions directly: a rectangle is one action; a diamond is specifically a decision point with two or more possible paths leading out of it.
4. "Data flow is the same thing as a flowchart, just with a different name."
Revisit paragraph 4. A flowchart shows the order of decisions and steps; data flow specifically tracks what the information itself looks like — its form and value — as it moves through those steps.
Discussion Starters You Can Use Tomorrow
- Think of an app you use daily. If you had to draw its flowchart for just one feature, what decision points (diamonds) would you need to include?
- Why might a professional software team insist on documentation even when only one or two people wrote the original code?
- Describe a situation where skipping documentation could cause a real problem for a team working on a complex program.
Bringing It Home
This topic is a natural one for families. One ten-minute activity to try: Together, pick a routine your family follows that includes at least one decision (what to make for dinner depending on what's in the fridge, which route to take depending on traffic). Ask your student to sketch it as a flowchart with at least one diamond-shaped decision point, then explain what information changes at each step. There are no wrong answers — the goal is hearing their reasoning.
Where This Leads
Students who can use visual aids and documentation, including flowcharts and pseudocode, to illustrate the design elements and data flow of a complex program's development are building skills used every day in software engineering, systems analysis, technical writing, and quality assurance / testing.
See the Unit in Action
Get the Complete L1.AP.PD.04 Unit
I built a complete, no-prep unit for this standard — Illustrating Program Design: Flowcharts, Pseudocode, and Data Flow — covering 3-4 days of instruction across 44 pages:
- Teacher guide — day-by-day pacing, misconceptions to watch for, discussion questions, differentiation for support / ELL / extension, and a 4-point rubric
- Student learning target page — a kid-friendly "I can" statement with success criteria
- Full content lesson with 3 embedded "Check Your Understanding" checkpoints
- 12-question assessment (6 multiple choice, 4 true/false, 2 short answer) with a complete answer key, explanations, and exemplar responses
- Group activity — "Illustrate It: Design a Complex Program's Blueprint" (25-30 minutes)
- Individual activity — "My Design Documentation Log" (20 minutes)
- Crossword and word search built from all 12 vocabulary terms (with answer keys)
- Family connection letter — a plain-language page for parents, with dinner-table questions and a 10-minute home activity
- Certificate of achievement — ready to sign and send home
- Program Scenario Card Set: Illustrate It (separate printable, 2 pages)
- Reference Sheet: Flowchart Symbols, Pseudocode, and Data Flow (separate printable, 2 pages)
- My Design Documentation Log (separate printable, 2 pages)
Get Illustrating Program Design: Flowcharts & Pseudocode on Teachers Pay Teachers →
Also aligned to CSTA 3A-AP-11: Use flowcharts and/or pseudocode to address complex problems, and identify data types.
Every Sooner Standards resource is built directly from the official Oklahoma Academic Standards for Computer Science (February 2023) — standard text verified, never paraphrased from memory.