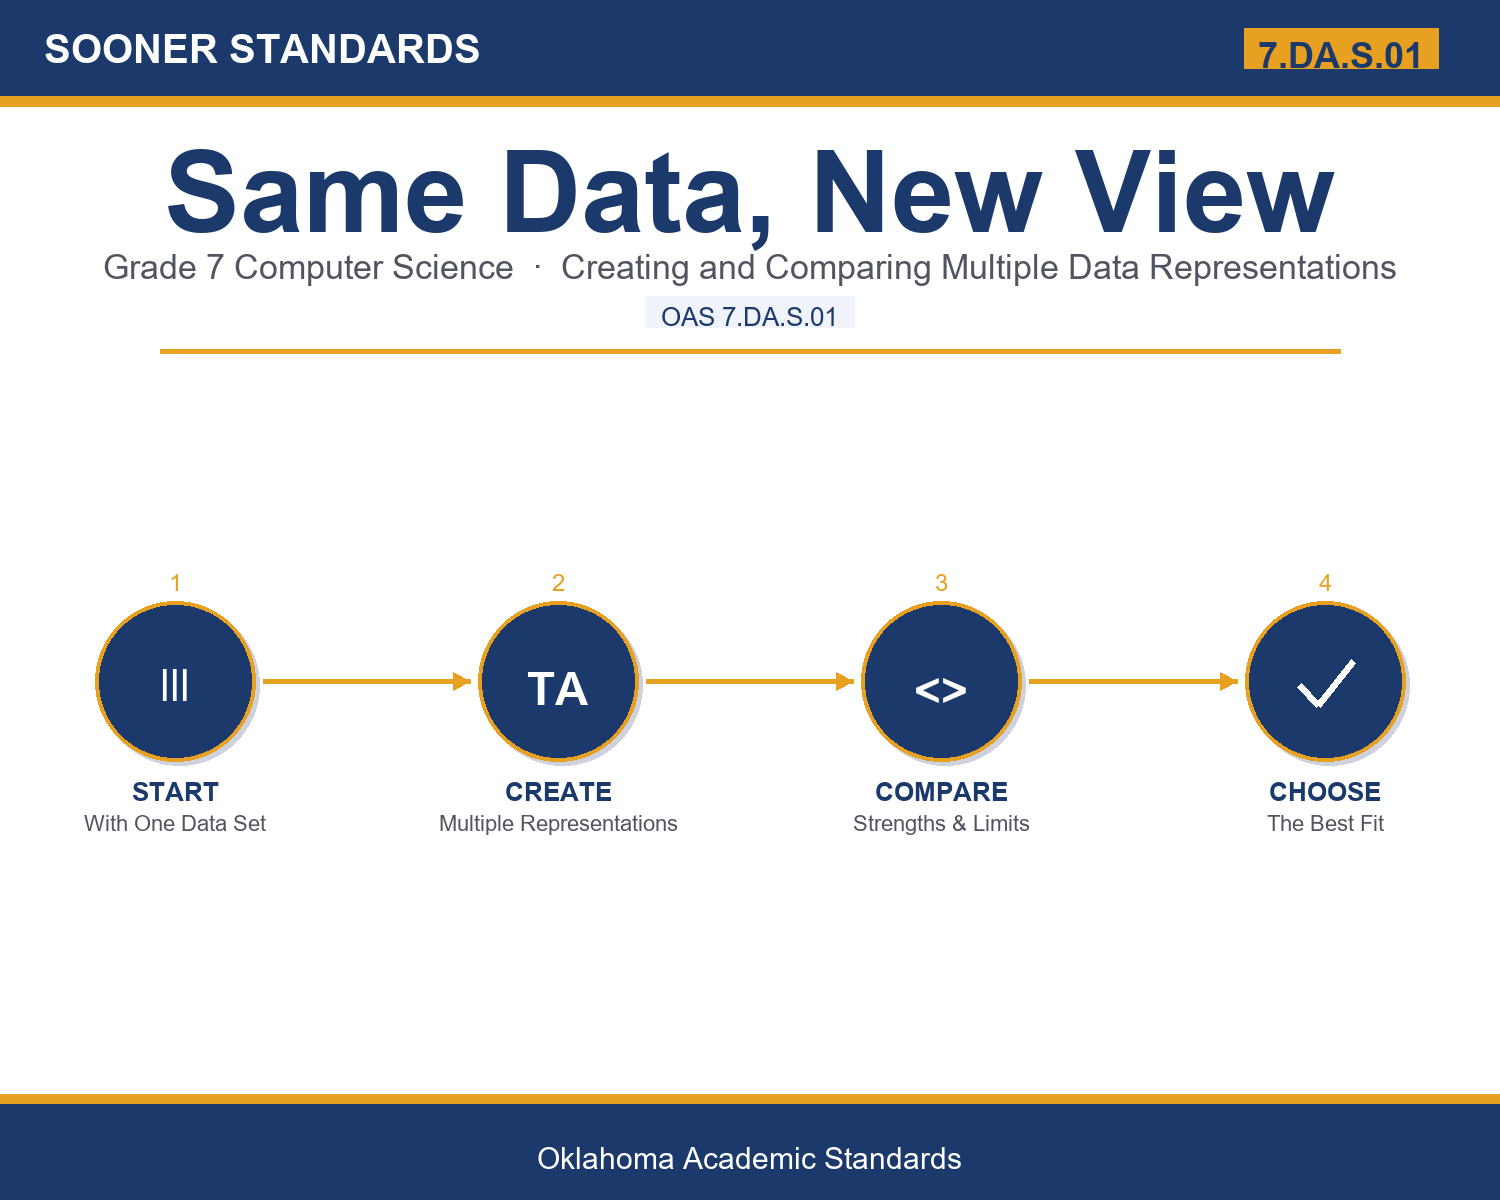
Teaching Same Data, New View in Grade 7: Oklahoma Standard 7.DA.S.01
Teaching Same Data, New View in Grade 7: Oklahoma Standard 7.DA.S.01
Teaching data representation methods in grade 7 does not have to be complicated. Picture a database administrator creating multiple representations of stored data to support different reporting needs. That kind of thinking is exactly what Oklahoma's grade 7 computer science standard 7.DA.S.01 asks students to practice — and it is very teachable with the right materials. This post walks through what the standard means, the misconceptions students bring to it, and discussion starters you can use tomorrow, whether you teach in a classroom or at your kitchen table.
What Does Standard 7.DA.S.01 Actually Ask?
Create and compare multiple representations of the same data. — Oklahoma Academic Standards for Computer Science (February 2023)
In plain language: Oklahoma's standard asks seventh graders to create and compare multiple representations of the same data.
In student-friendly terms, the learning target is: "I can create and compare multiple representations of the same data."
What Students Should Be Able to Do
- I can create several accurate, genuinely different representations of one data set.
- I can clearly compare strengths and weaknesses across representations.
- I can accurately identify specific strengths of each representation.
- I can accurately identify specific limitations of each representation.
Along the way, students pick up the working vocabulary of the topic: representation, table, tally, compare, structure, category, precise, overview, sort, summarize, context, appropriate.
Data Representation Methods: Misconceptions to Watch For
These are the wrong turns students reliably take with this standard — knowing them ahead of time is half the lesson plan. Each correction strategy below comes straight from the unit's teacher guide (the paragraph and activity references point into the unit itself).
1. "One representation type is always the best choice no matter the situation."
Use paragraph 5's key point — no single representation is universally best; each is better suited to certain specific purposes.
2. "All representations of the same data show exactly the same amount of detail."
Reference paragraph 8 — there's a genuine tradeoff between detail and simplicity across different representations.
3. "A bar graph always shows information more precisely than a table."
Point to paragraph 4 — bar graphs excel at visual comparison, but tables are more precise for exact individual values.
4. "Comparing representations is unnecessary if you've already created one."
Clarify from paragraph 7 — comparing representations can reveal hidden details a single representation might hide.
Discussion Starters You Can Use Tomorrow
- Why do you think some reports use tables while others use charts for the exact same kind of information?
- What's an example of data you'd want represented as a quick visual overview rather than an exact table?
- Why might a research scientist create multiple representations of the same experimental data?
Bringing It Home
This topic is a natural one for families. One ten-minute activity to try: Together, take a simple data set, like favorite foods among family members, and represent it two different ways, then discuss which representation works better for a specific purpose.
Where This Leads
Students who can create and compare multiple representations of the same data are building skills used every day in database administration, business analysis, research science, software development, and computer science education.
See the Unit in Action
Get the Complete 7.DA.S.01 Unit
I built a complete, no-prep unit for this standard — Creating and Comparing Multiple Data Representations — covering 3-4 days of instruction across 35 pages:
- Teacher guide — day-by-day pacing, misconceptions to watch for, discussion questions, differentiation for support / ELL / extension, and a 4-point rubric
- Student learning target page — a kid-friendly "I can" statement with success criteria
- Full content lesson with 3 embedded "Check Your Understanding" checkpoints
- 12-question assessment (6 multiple choice, 4 true/false, 2 short answer) with a complete answer key, explanations, and exemplar responses
- Group activity — "Create and Compare Three Representations" (45-50 minutes)
- Individual activity — "Represent and Compare My Own Data" (40-50 minutes)
- Crossword and word search built from all 12 vocabulary terms (with answer keys)
- Family connection letter — a plain-language page for parents, with dinner-table questions and a 10-minute home activity
- Certificate of achievement — ready to sign and send home
- Representation Practice and Reference Materials (separate printable, 1 page)
Get Same Data, New View on Teachers Pay Teachers →
Every Sooner Standards resource is built directly from the official Oklahoma Academic Standards for Computer Science (February 2023) — standard text verified, never paraphrased from memory.