Teaching Finding the Signal: Identifying Data Patterns in Grades 11-12 (Level 2): Oklahoma Standard L2.DA.CVT.01
Teaching Finding the Signal: Identifying Data Patterns in Grades 11-12 (Level 2): Oklahoma Standard L2.DA.CVT.01
Teaching data analysis patterns in grades 11-12 (level 2) does not have to be complicated. Picture a business analyst filtering and aggregating sales data to spot a trending product before a competitor notices. That kind of thinking is exactly what Oklahoma's grades 11-12 (level 2) computer science standard L2.DA.CVT.01 asks students to practice — and it is very teachable with the right materials. This post walks through what the standard means, the misconceptions students bring to it, and discussion starters you can use tomorrow, whether you teach in a classroom or at your kitchen table.
What Does Standard L2.DA.CVT.01 Actually Ask?
Use data analysis tools and techniques to identify patterns from complex real-world data. — Oklahoma Academic Standards for Computer Science (February 2023)
In plain language: This standard asks students to use data analysis tools and techniques to find real patterns — trends, correlations, groups, and unusual points — inside complicated, real-world data, and to explain the evidence behind what they find.
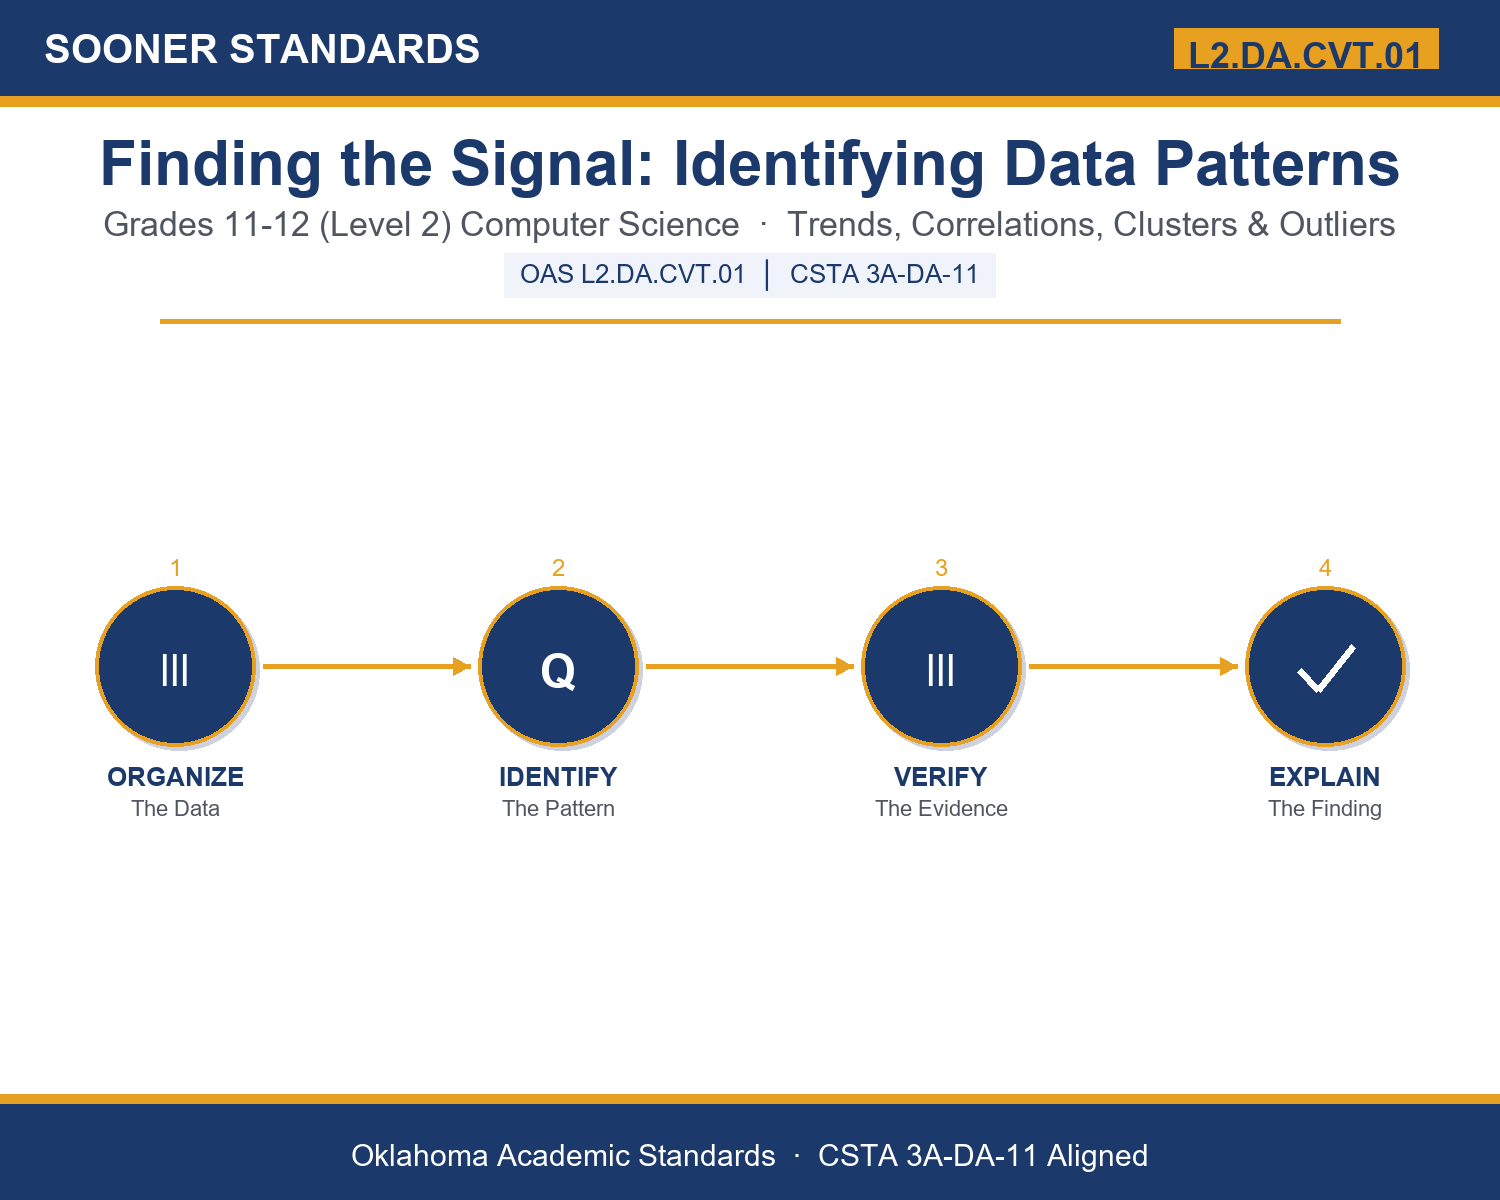
In student-friendly terms, the learning target is: "I can use data analysis tools and techniques — sorting, filtering, aggregating, and visualizing — to identify patterns such as trends, correlations, clusters, and outliers in complex real-world data, and explain the evidence behind each pattern."
What Students Should Be Able to Do
- I can use sorting, filtering, and aggregating to organize a messy dataset so a pattern becomes visible.
- I can identify a trend, correlation, cluster, or outlier in a data set and explain what evidence supports my identification.
- I can explain why a correlation does not prove causation and propose an alternative explanation for a correlated pattern.
- I can explain how a biased sample or an unequal aggregation can hide or distort a real pattern.
Along the way, students pick up the working vocabulary of the topic: dataset, pattern, trend, correlation, causation, outlier, cluster, variable, sample, filter, aggregate, distribution, anomaly, metric.
Data Analysis Patterns: Misconceptions to Watch For
These are the wrong turns students reliably take with this standard — knowing them ahead of time is half the lesson plan. Each correction strategy below comes straight from the unit's teacher guide (the paragraph and activity references point into the unit itself).
1. "If two variables are correlated, one must be causing the other."
Return to the ice cream and drowning example in paragraph 3. Have students brainstorm a hidden third variable for a correlation they find, and practice the sentence stem: 'This could be caused by ____ instead.'
2. "An outlier should always be deleted from the data before analyzing it."
Use the paragraph 4 example of the 950-degree temperature reading versus a real traffic spike. Have students practice asking 'is this a real event or an error?' before deciding what to do with an outlier.
3. "A short-term pattern (a few days or weeks) is proof of a real, lasting trend."
Revisit paragraph 2's three-week sales example. Have students identify how much data (how many time periods) they would want to see before trusting a trend.
4. "If the overall average looks fine, everyone in the group is doing fine."
Use paragraph 5's grouped-average example. Have students aggregate a small sample dataset two ways — as one whole group and broken out by subgroup — and compare what each reveals.
Discussion Starters You Can Use Tomorrow
- Describe a claim you have seen online that used a correlation as if it were causation. What alternative explanation might the claim be missing?
- Why might two different analysts, looking at the exact same dataset, choose different techniques (sorting vs. filtering vs. aggregating) to answer the same question?
- If a survey only reaches people with internet access, what kinds of patterns might it miss entirely?
Bringing It Home
This topic is a natural one for families. One ten-minute activity to try: Together, look at a real table of numbers your family already has access to — a sports team's stats, a utility bill history, or a fitness app's weekly summary. Ask your student to find one pattern in it and explain what evidence in the numbers supports their answer. There are no wrong answers — the goal is hearing their reasoning about the evidence.
Where This Leads
Students who can use data analysis tools and techniques — sorting, filtering, aggregating, and visualizing — to identify patterns such as trends, correlations, clusters, and outliers in complex real-world data, and explain the evidence behind each pattern are building skills used every day in data analysis / business intelligence, public health / epidemiology, sports analytics, journalism / data reporting, and computer science education.
See the Unit in Action
Get the Complete L2.DA.CVT.01 Unit
I built a complete, no-prep unit for this standard — Finding the Signal: Identifying Patterns in Complex Real-World Data — covering 3-4 days of instruction across 42 pages:
- Teacher guide — day-by-day pacing, misconceptions to watch for, discussion questions, differentiation for support / ELL / extension, and a 4-point rubric
- Student learning target page — a kid-friendly "I can" statement with success criteria
- Full content lesson with 3 embedded "Check Your Understanding" checkpoints
- 12-question assessment (6 multiple choice, 4 true/false, 2 short answer) with a complete answer key, explanations, and exemplar responses
- Group activity — "Data Detectives: Finding the Real Pattern" (25-30 minutes)
- Individual activity — "My Data Analysis Log" (20-25 minutes)
- Crossword and word search built from all 14 vocabulary terms (with answer keys)
- Family connection letter — a plain-language page for parents, with dinner-table questions and a 10-minute home activity
- Certificate of achievement — ready to sign and send home
- Data Case Card Set: Finding the Real Pattern (separate printable, 2 pages)
- Reference Notes: Identifying Patterns in Complex Data (separate printable, 2 pages)
- My Data Analysis Log (separate printable, 2 pages)
Get Finding the Signal: Identifying Data Patterns on Teachers Pay Teachers →
Also aligned to CSTA 3A-DA-11: Use data analysis tools and techniques to identify patterns in data to represent them in charts, graphs, or other visualizations to communicate results in the context of the problem.
Every Sooner Standards resource is built directly from the official Oklahoma Academic Standards for Computer Science (February 2023) — standard text verified, never paraphrased from memory.